
Adapted from the August 2026 issue of my newsletter. Sign up to get the next one by email.
This issue is a break. The work we do around homelessness is heavy, and most of what lands in this newsletter is deadlines, rules, and data problems. Not this month. This month I just want to show you some things you may or may not like, and let you say so.
Here is how this field usually works: someone hands you a dashboard, fully finished, and nobody ever asked whether it made sense to you, whether you could read it, or whether it was any good. This flips that around. I have built more than forty visualizations about housing, emergency access, and community decision-making, and before any of them go near a real dashboard, I want your opinion first.
If you have ever sat in a meeting, stared at a chart, and quietly thought “I have no idea what this is telling me,” this is your chance to say it out loud to someone who actually wants to hear it. Every visualization is drawn three times over, for a large, a mid-size, and a small community, so you can also see where a chart holds up and where it falls apart.
Below are five to start with. Rating could not be easier: every star, thumb, and comment saves itself the moment you click it. No account, no submit button, and a name is optional.
No homework here
Rate a few that catch your eye and skip the rest. There are no wrong answers, and honest beats polite. As you look:
- Which ones are easiest to understand?
- Which ones make you want to learn more?
- Which ones feel confusing or overloaded?
- Which ones seem most useful for communities, advocates, or decision-makers?
If a chart confuses you, that is not your failure. It is mine, and it is the single most useful thing you can tell me.
1. The system as a bathtub
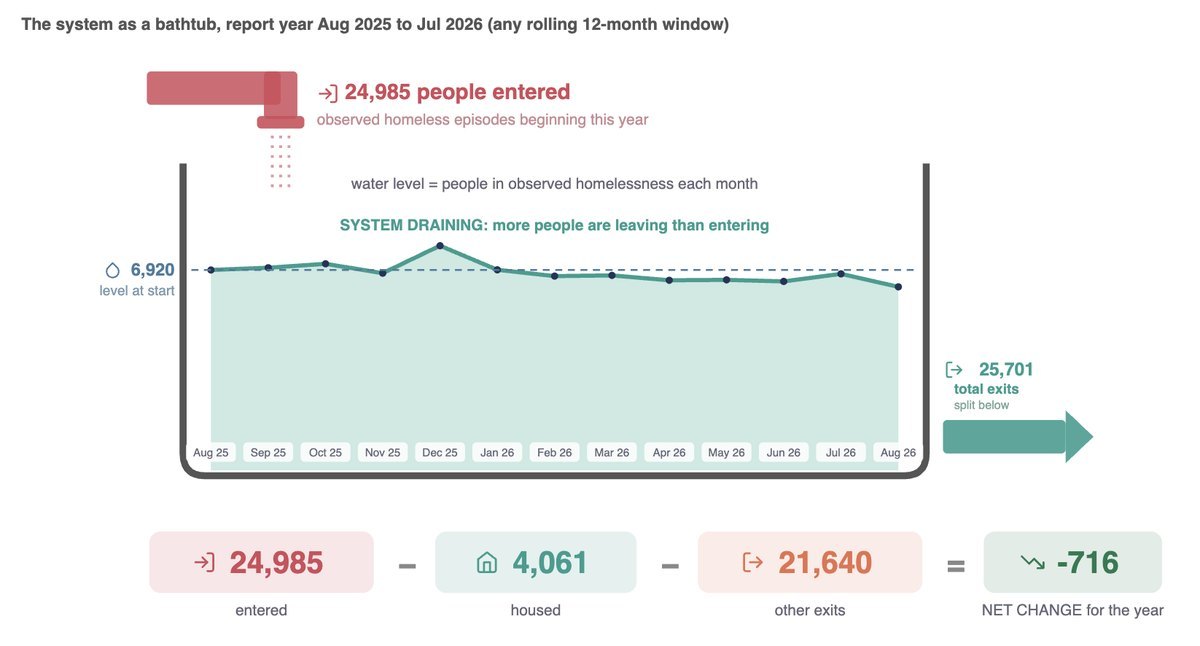
This is a whole year in one picture. The faucet is people entering homelessness, the drain is people leaving, and the water level is how many people are homeless in any given month. When the drain runs faster than the faucet, the level drops.
The row along the bottom is that same story as plain arithmetic: everyone who entered, minus everyone housed, minus everyone who left some other way, equals the change for the year. Most people can read this one without being taught how, which is exactly the thing I want to test.
Tell me: Does “draining” land as a good thing without me having to explain it? And does the metaphor help you, or talk down to you?
2. The system as states and movements
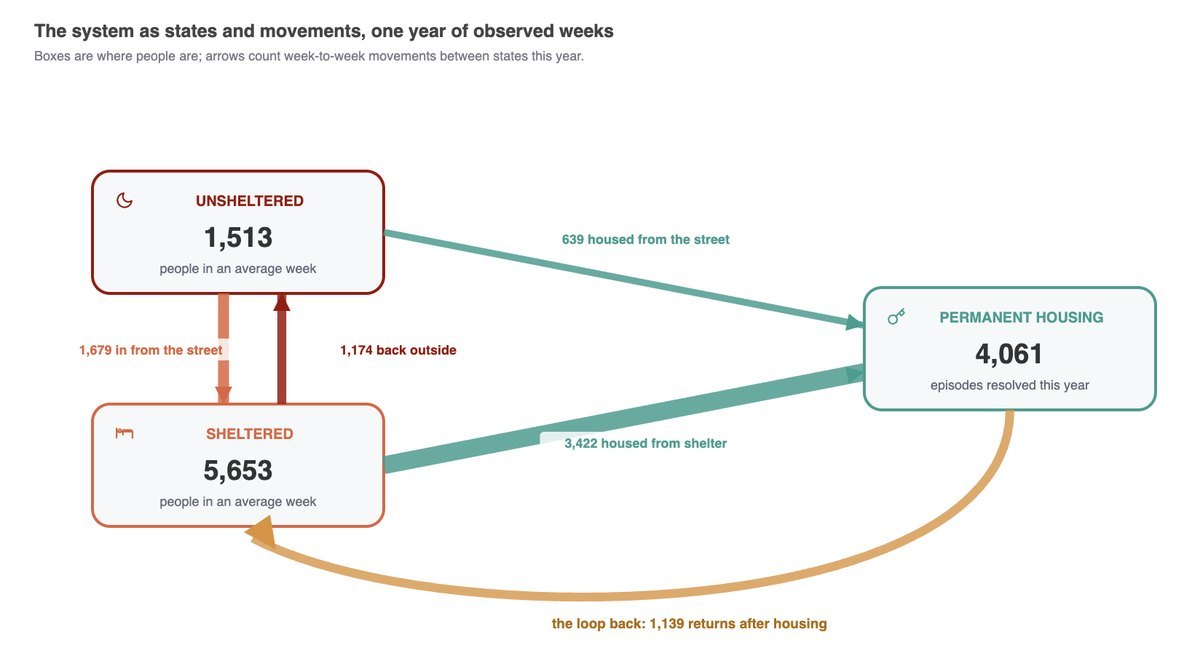
Every box is a place a person can be in a given week: outside, in shelter, or housed. Every arrow counts how many times people actually moved between those places over a year, so the picture is about movement rather than a single snapshot.
The arrow that matters most is the long one across the bottom, the loop back: people who were housed and then returned. Most system diagrams leave that arrow off entirely, which quietly turns the system into a one-way trip. It is not one.
Tell me: Does the movement read at a glance, or do the arrows just look busy? One specific thing: can you tell “people in an average week” apart from “episodes resolved this year” without being told?
3. The measures of a moving system
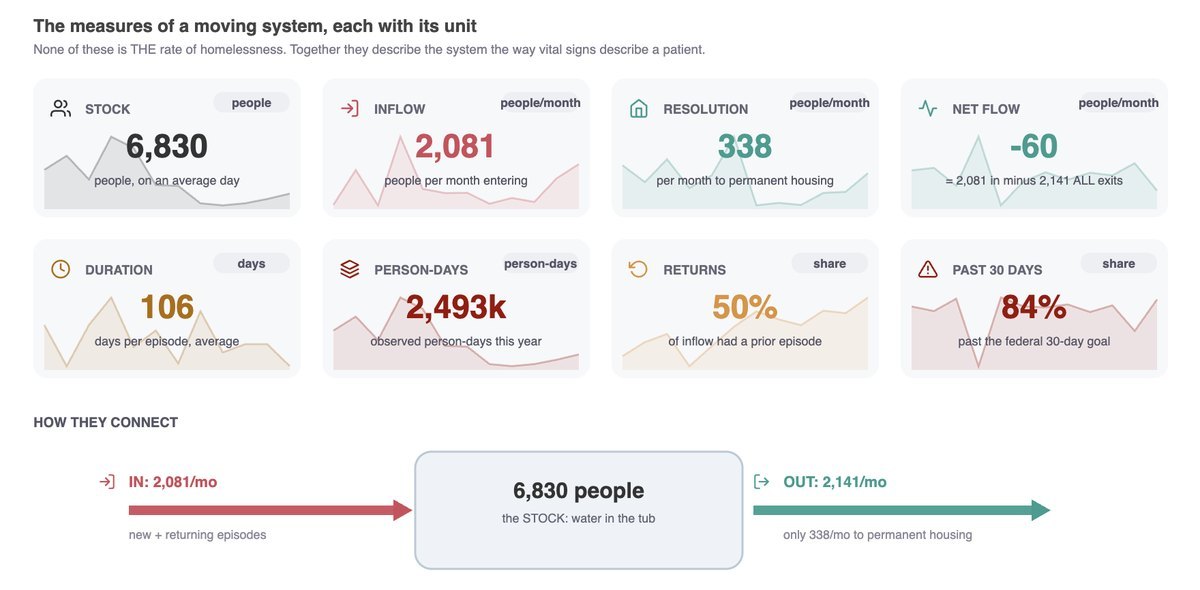
Eight numbers people use to describe homelessness, each tagged with the unit it is actually in. That tag matters more than it looks. A count of people, a rate per month, an average number of days, and a percentage are four different kinds of thing, and they get quoted against each other as if they were the same.
None of these is THE rate of homelessness. Together they work the way vital signs work for a patient: no single one tells you how someone is doing. The strip underneath shows how they connect, with what flows in on one side and what flows out on the other.
Tell me: Do the unit labels help, or are eight numbers at once too many for an opening screen rather than a reference page?
4. Seven gauges, one system
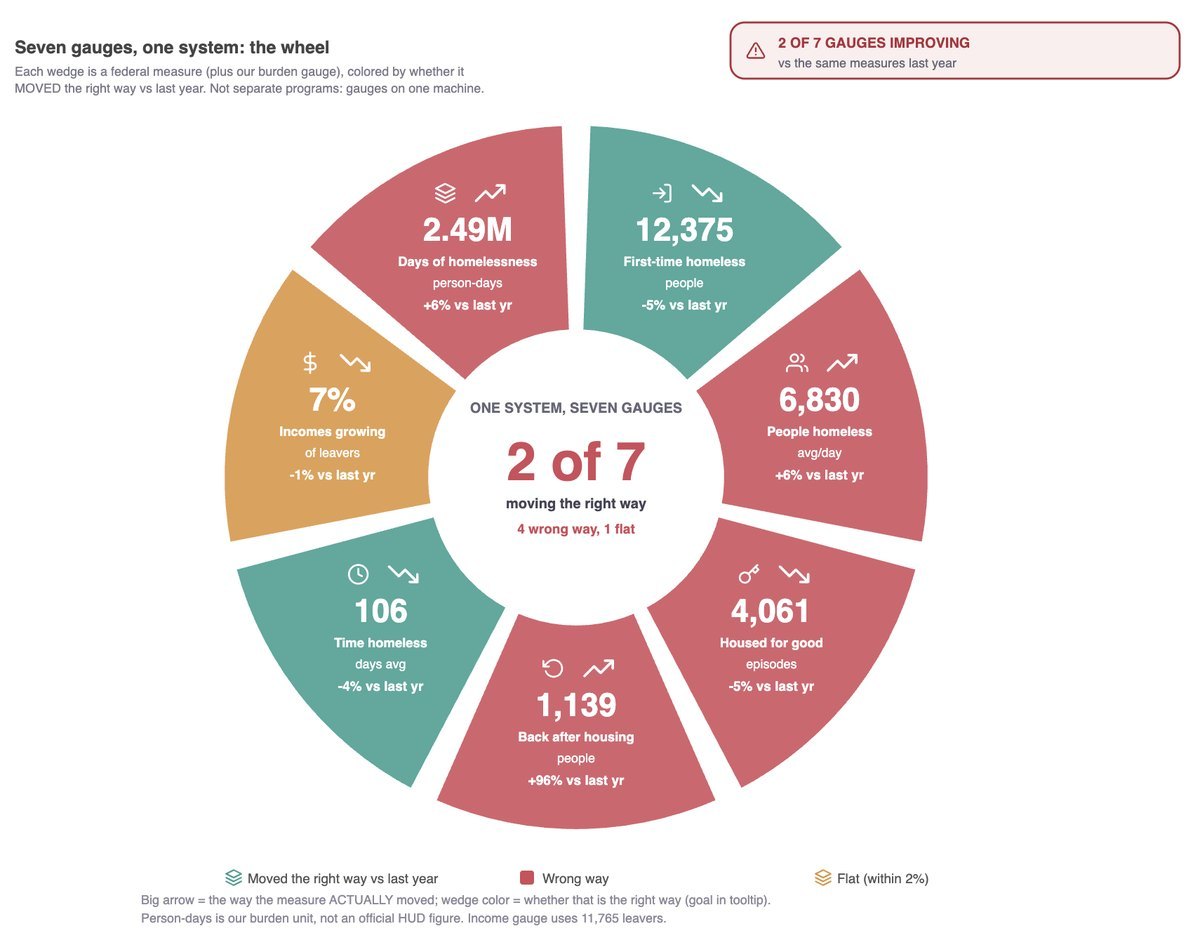
Seven federal measures drawn as wedges on a single wheel, because they are not seven separate programs. They are gauges on one machine, and reading them one at a time is how a system gets called a success and a failure in the same meeting.
The color is the part I most want tested. It does not mean a number is big or small. It means the number moved the right way, or the wrong way, compared to last year. Two of seven moved the right way, and the middle of the wheel says so before you read a single wedge.
Tell me: Is it clear that the color means direction, not size, without reading the legend? And does making all seven wedges the same size wrongly suggest all seven matter equally?
5. The year bent into a clock
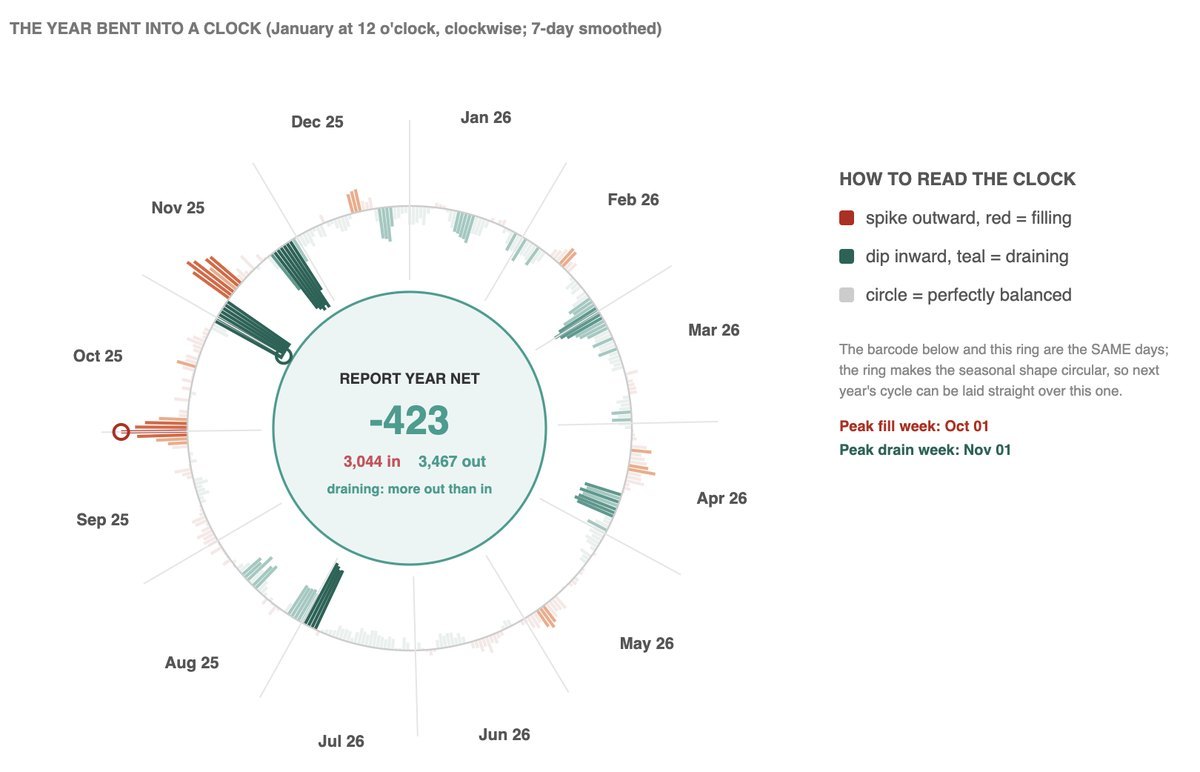
A full year of daily change, wrapped into a circle with January at twelve o’clock. Spikes pointing outward are the weeks the system filled, dips pointing inward are the weeks it drained, and a perfect circle would mean perfectly in balance.
The reason for bending a year into a ring is that next year can be laid straight over this one, so a seasonal pattern shows up as a shape instead of disappearing into a long flat line. It is also the biggest gamble of the five, and I would rather hear that now than after it ships.
Tell me: Does a seasonal pattern actually jump out at you, or does this first read as decorative complexity? It is the most experimental of the five and the one I am most ready to cut.
Thank you for looking while this is still forming
Thanks for taking the break with me. Your feedback will directly shape which of these get developed further and which get cut. Even three ratings help, and every single mark reaches me.
Reach me on LinkedIn, schedule a meeting at GaitherDyn.com/meeting, or email me at Gaither.Stephens@GaitherDyn.com. Send your colleagues to GaitherDyn.com/sign-up.
PS: October, and a pilot taking shape
Two places you can find me in October. I will be speaking twice at The Cost of Inaction: Who Pays the Price?, put on by Person Centered Housing Options, October 6 and 7 in Henrietta, New York, with keynote speaker India Walton. Three weeks later I will be exhibiting at the NHSDC Fall Conference, October 27 through 29 in Cleveland. Come find the booth; the visualizations in this post will all be there to rate live.
Past that, I am already gearing up for next year: I am preparing my keynote for the Kansas Statewide Homeless Coalition Summit on Homelessness and Housing in April 2027. Work like the charts above is where that talk is going to come from, which is another reason your reactions now are worth so much to me.
And one thing still taking shape. The Housing Emergency Access Tool I wrote about in July now lives at housingtriage.org, and the possible community pilot took a concrete step this month: a community has raised its hand, and we are building their version of the tool together. More on that as it develops.